JCLDEBUGHANDLER
The JCLDebugHandler is a non-visual component from the JEDI VCL Library that allows you to extract the JCLDebugger's exception stack tracing information in a much simpler manner. For the purposes of this discussion, the JCLDebugHandler's interaction with CodeSite is arguably the easiest to set up.
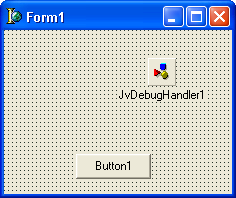
Simply drop a TJvDebugHandler component from the JEDI Library's JvSystem tab on the component palette onto your main form. We do not need to include either the CodeSite or CodeSiteEx component on the form. See the screenshot below:
The big difference between the JCLDebugHandler and direct usage of the JEDI Debugger itself is the reliance on the TcsxErrorTrapControl. The JEDI Debugger is included in the CSX.INC file and built into the TcsxErrorTrapControl; properties to interface with the JEDI Debugger are added to the TcsxErrorTrapControl component.
The JCLDebugHandler is simpler because it is its own entity that redirects its messages to CodeSite. There is no need to update the CSX.INC file because the JCLDebugHandler is doing the work and reporting on the exceptions, not CodeSiteEx. It is because of this that the JCLDebugHandler works equally well with CodeSite as with CodeSiteEx. In addition, it can report to its own LogFile, if desired.
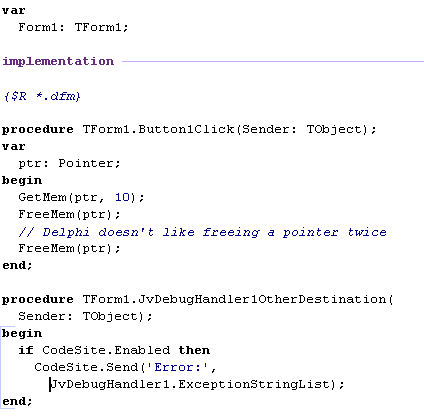
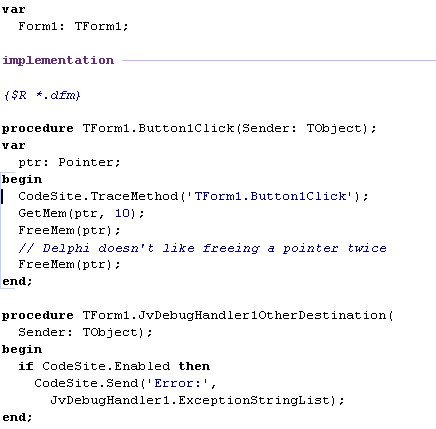
After dropping the JCLDebugHandler component on our main form, we have to add a line of code to its OnOtherDestination event. This tells the JCLDebugHandler to redirect its output to a specific destination; in our case, CodeSite.
Note: for CodeSite version 2, the line should read CodeSite.SendStringList('Error:', JvDebugHandler1.ExceptionStringList);
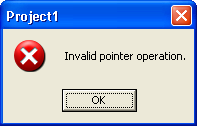
When we run this code, the following error message is still displayed:
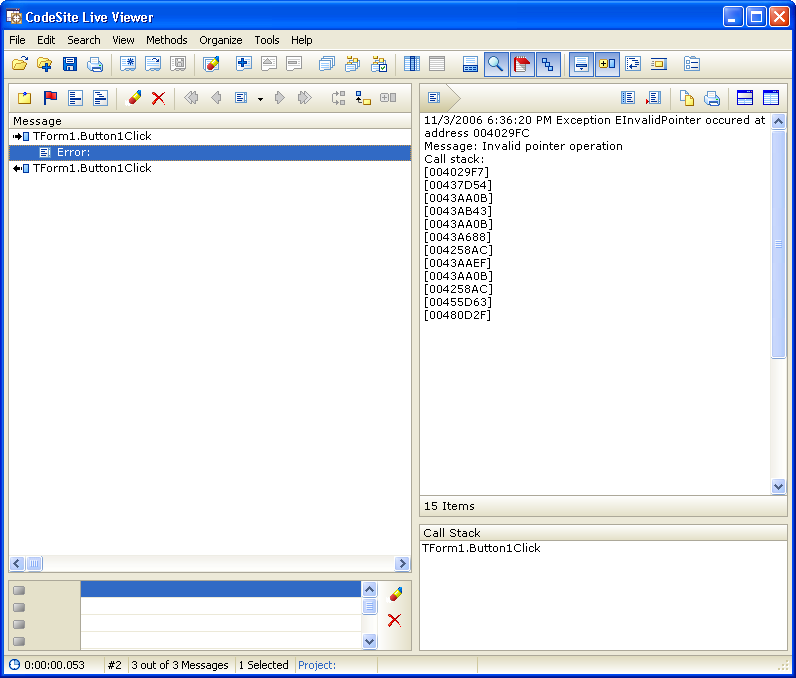
Let's check what is sent to the CodeSite Viewer. Click on the thumbnail to see the CodeSite Viewer's contents full size.
The Inspector Pane displays the exception, including it's type, date and time stamp, message and a complete call stack. Exactly matching the output when using the JCLDebugger. Why, you may ask? Because the JCLDebugHandler is a wrapper for the JCLDebugger.
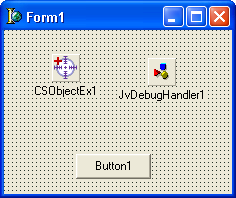
You may notice that no EnterMethod and ExitMethod messages are in the viewer. That is because we did not include the CSObjectEx object and the TraceMethod call. Changing our form to this:
And updating our source code as follows:
... will result in the following being sent to the CodeSite Viewer (click on the thumbnail to see the Viewer's contents full size):