JCLDEBUGGER
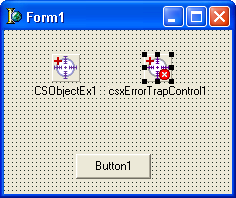
Use of the JEDI Debugger (JCLDebug) involves adding properties to the TcsxErrorTrapControl. This being the case, in order to use the JEDI Debugger's enhanced exception handling features, we must still use the CSX Error Trap Control. For this example, we will leave both the TCSObjectEx and the TcsxErrorTrapControl components on our form.
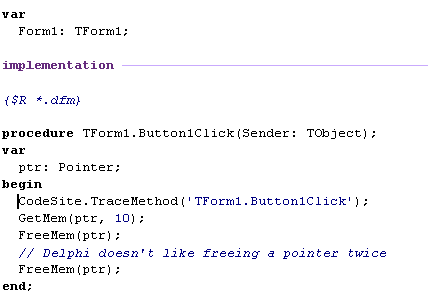
No change is required to our code to enable the error trapping. The only thing we must do is set the Error Trap Control's Enabled property to TRUE. For the purposes of our demonstration, we will leave our ButtonClick event exactly as it was in our test involving just CodeSiteEx, as seen below:
When we run this code, we will receive our error message again:
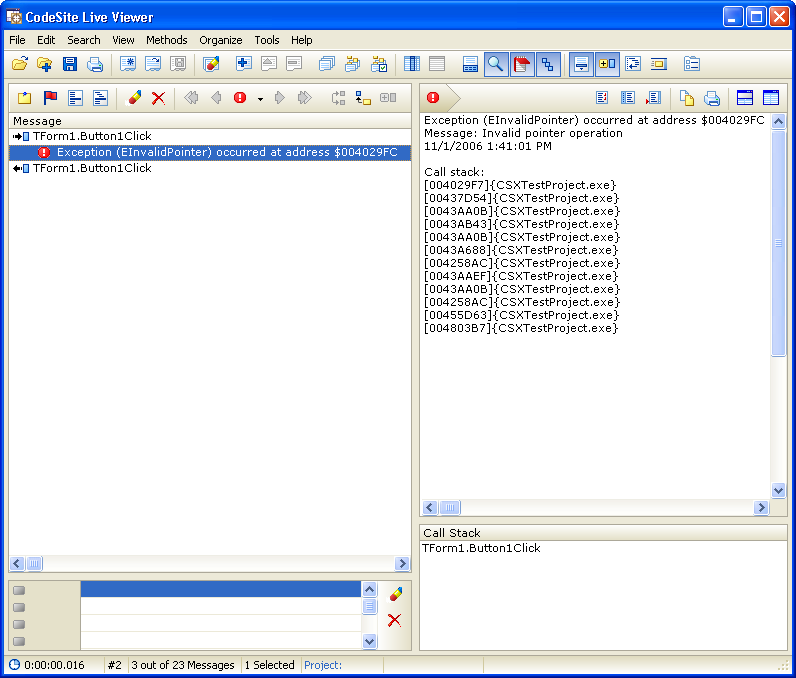
This time something much more useful is sent to the CodeSite viewer. Click on the thumbnail below to display the full contents of the CodeSite viewer.
In addition to the exception details presented using just the Error Trap Control, the Inspector Pane now includes a complete call stack for this exception. And the best part is no extra code was required!
The exact details returned can be fine-tuned as desired using the new properties exposed in the TcsxErrorTrapControl when CodeSiteEx is compiled with JEDI Debugger support. It will be left as an exercise to see just what you can get out of this debugger.
Want to try a different way of using the JCLDebug utility? Try the JCLDebugHandler!